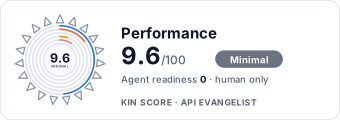
An index and topic collection covering API and web performance, including load testing, performance benchmarking, real user monitoring (RUM), Core Web Vitals measurement, latency profiling, distributed tracing, and application performance monitoring (APM). Performance engineering ensures that APIs and web applications meet latency, throughput, and reliability expectations under realistic and adversarial load. This collection brings together open-source load generators like k6, Apache JMeter, Locust, Gatling, and Artillery; managed load and chaos platforms like StormForge and Speedscale; synthetic and real-user measurement tools like Google PageSpeed, Pingdom, and Akamai; and APM and tracing platforms like Datadog, New Relic, Dynatrace, AppDynamics, Sentry, Honeycomb, Instana, Lightstep, SigNoz, Uptrace, OpenTelemetry, Jaeger, Grafana Tempo, Google Cloud Profiler, Google Cloud Trace, and AWS X-Ray.
Performance is profiled on the APIs.io network. Tagged areas include Performance, Load Testing, Performance Testing, Real User Monitoring, and Core Web Vitals.
The Performance catalog on APIs.io includes 1 JSON-LD context.
Performance’s developer surface includes developer portal and 1 more developer resources.
Regulatory Posture applies to this provider. Its tags matched the
Horizontal (data, software, accessibility, platform) regime, so
Regulatory Posture carries 15 points of the composite.
If this regime is wrong for your business, say so on your
provider repo — the
applicability map is public and we will correct it.
Create-or-Update Ergonomics could not be measured. We hold no machine-readable contract for
this provider to read, so there is nothing to measure a write surface against. Excluded rather than scored zero:
never-measured and measured-empty are different facts. Publishing an OpenAPI is what makes this facet — and
several others — scorable at all.
The six quality facets above are damped to 85 points between them,
because the conditional facet above carries the other
15. That is why each facet's contribution is shown against a damped
maximum: raising a quality facet moves the composite by 85% of its nominal
weight, not 100%. The full arithmetic is at apis.io/rating/.
Show this score on your site.
It updates itself when the score changes. Paste this where you link to your API docs:
<a href="https://apis.io/providers/performance/"><img src="https://apis.io/badge/performance/card.svg" alt="Performance on APIs.io — Kin Score by API Evangelist"></a>
Other styles, a README pill and a shields.io endpoint are on the badge page.
Improve this rating by publishing the missing artifacts — every area above can be raised, and the full rubric is at apis.io/rating/. Every facet and dimension name above is a link: it opens that measurement's own page — what it means, the exact checks that feed it, how the whole catalog distributes on it, and the providers at the top of it. This rating is computed from github.com/api-evangelist/performance: open an issue to ask a question, or submit a pull request to add artifacts.
Submit an artifact on GitHub — free →Manage your own listing — the Influence plan, $499/mo →
Open-source and managed load generators like k6, Apache JMeter, Locust, Gatling, and Artillery simulate concurrent users and traffic patterns against APIs to characterize throug...
Performance Benchmarking
Repeatable, scripted benchmark runs establish performance baselines and detect regressions in CI/CD pipelines using tools like k6 Cloud, BlazeMeter, and StormForge.
Real User Monitoring (RUM)
RUM products like Akamai mPulse, Datadog RUM, New Relic Browser, Sentry Performance, and Pingdom capture latency, errors, and Core Web Vitals from real browser sessions in produ...
Synthetic Monitoring and Web Vitals
Synthetic checks and lab-based audits from Google PageSpeed (Lighthouse), WebPageTest, and Pingdom measure Core Web Vitals (LCP, INP, CLS) and uptime from controlled environments.
Distributed Tracing
OpenTelemetry, Jaeger, Grafana Tempo, Honeycomb, Lightstep, Google Cloud Trace, and AWS X-Ray collect distributed traces across microservice calls to attribute latency to specif...
Application Performance Monitoring (APM)
APM platforms like Datadog APM, New Relic, Dynatrace, AppDynamics, Instana, SigNoz, and Uptrace correlate traces, metrics, and logs to surface slow transactions and code-level b...
Profiling and Code Hotspots
Continuous profilers like Google Cloud Profiler and Datadog Continuous Profiler identify CPU, memory, and lock contention hotspots in running services.
Traffic Replay and Chaos
Tools like GoReplay and Speedscale capture production traffic and replay it against staging or new versions to validate performance and behavior before release.
Engineering teams run k6 or JMeter scenarios on every pull request to verify that p95 latency and error rates stay within service-level objectives before merging.
Core Web Vitals Optimization
Web teams use Google PageSpeed, WebPageTest, and RUM data to optimize LCP, INP, and CLS to meet Google ranking and user-experience thresholds.
Capacity Planning and Scalability Validation
Platform teams use StormForge and BlazeMeter to drive sustained load tests against staging environments to determine maximum sustainable throughput and right-size infrastructure.
Latency Regression Detection
APM platforms like Datadog, New Relic, and Dynatrace alert on p95 and p99 latency regressions per endpoint or trace span after each deploy.
Production Traffic Replay
Teams use GoReplay or Speedscale to record real production traffic and replay it against release candidates to find performance and correctness regressions before rollout.
Distributed Trace Root-Cause Analysis
SREs use Honeycomb, Lightstep, Jaeger, or Grafana Tempo to drill into slow distributed traces and pinpoint the service, query, or downstream call responsible for tail latency.
Continuous Profiling of Hot Paths
Backend teams use Google Cloud Profiler or Datadog Continuous Profiler to identify CPU and memory hotspots in running services without rebuilding or redeploying.
Pre-built integrations with other platforms and tools.
k6
Open-source Grafana Labs load testing tool that uses JavaScript test scripts to drive load against HTTP, gRPC, and WebSocket APIs, with optional k6 Cloud for distributed runs.
Apache JMeter
Open-source Apache Software Foundation load testing tool for HTTP, REST, databases, JMS, and more, widely used for protocol-level performance testing.
Gatling
High-throughput, Scala-based open-source load testing tool with code-as-test scenarios and detailed HTML reports.
Artillery
Modern Node.js load testing toolkit with YAML and JavaScript scenarios, designed for serverless and Kubernetes-native workloads.
StormForge
Performance and load testing platform that uses machine learning to optimize Kubernetes resource configurations and validate scalability.
Datadog
Observability and APM platform offering distributed tracing, real user monitoring, synthetic monitoring, and continuous profiling.
New Relic
Full-stack observability platform with APM, browser-based RUM, synthetic monitoring, distributed tracing, and infrastructure metrics.
OpenTelemetry
Vendor-neutral CNCF standard for collecting traces, metrics, and logs, used to instrument applications for any compatible APM or tracing backend.
aid: performance
name: Performance
description: An index and topic collection covering API and web performance, including load testing, performance benchmarking,
real user monitoring (RUM), Core Web Vitals measurement, latency profiling, distributed tracing, and application performance
monitoring (APM). Performance engineering ensures that APIs and web applications meet latency, throughput, and reliability
expectations under realistic and adversarial load. This collection brings together open-source load generators like k6,
Apache JMeter, Locust, Gatling, and Artillery; managed load and chaos platforms like StormForge and Speedscale; synthetic
and real-user measurement tools like Google PageSpeed, Pingdom, and Akamai; and APM and tracing platforms like Datadog,
New Relic, Dynatrace, AppDynamics, Sentry, Honeycomb, Instana, Lightstep, SigNoz, Uptrace, OpenTelemetry, Jaeger, Grafana
Tempo, Google Cloud Profiler, Google Cloud Trace, and AWS X-Ray.
type: Index
image: https://kinlane-images.s3.amazonaws.com/shared/apis-json/apis-json-logo.jpg
tags:
- Performance
- Load Testing
- Performance Testing
- Real User Monitoring
- Core Web Vitals
- APM
- Distributed Tracing
- Latency
url: https://raw.githubusercontent.com/api-evangelist/performance/refs/heads/main/apis.yml
created: '2026-05-19'
modified: '2026-05-19'
specificationVersion: '0.19'
apis: []
network:
- name: k6
url: https://raw.githubusercontent.com/api-evangelist/k6/refs/heads/main/apis.yml
- name: Apache JMeter
url: https://raw.githubusercontent.com/api-evangelist/apache-jmeter/refs/heads/main/apis.yml
- name: Locust
url: https://raw.githubusercontent.com/api-evangelist/locust/refs/heads/main/apis.yml
- name: Gatling
url: https://raw.githubusercontent.com/api-evangelist/gatling/refs/heads/main/apis.yml
- name: Artillery
url: https://raw.githubusercontent.com/api-evangelist/artillery/refs/heads/main/apis.yml
- name: StormForge
url: https://raw.githubusercontent.com/api-evangelist/stormforge/refs/heads/main/apis.yml
- name: Speedscale
url: https://raw.githubusercontent.com/api-evangelist/speedscale/refs/heads/main/apis.yml
- name: GoReplay
url: https://raw.githubusercontent.com/api-evangelist/goreplay/refs/heads/main/apis.yml
- name: Google PageSpeed
url: https://raw.githubusercontent.com/api-evangelist/google-pagespeed/refs/heads/main/apis.yml
- name: Pingdom
url: https://raw.githubusercontent.com/api-evangelist/pingdom/refs/heads/main/apis.yml
- name: Akamai
url: https://raw.githubusercontent.com/api-evangelist/akamai/refs/heads/main/apis.yml
- name: Datadog
url: https://raw.githubusercontent.com/api-evangelist/datadog/refs/heads/main/apis.yml
- name: New Relic
url: https://raw.githubusercontent.com/api-evangelist/new-relic/refs/heads/main/apis.yml
- name: Dynatrace
url: https://raw.githubusercontent.com/api-evangelist/dynatrace/refs/heads/main/apis.yml
- name: AppDynamics
url: https://raw.githubusercontent.com/api-evangelist/appdynamics/refs/heads/main/apis.yml
- name: Instana
url: https://raw.githubusercontent.com/api-evangelist/instana/refs/heads/main/apis.yml
- name: Sentry
url: https://raw.githubusercontent.com/api-evangelist/sentry/refs/heads/main/apis.yml
- name: Honeycomb
url: https://raw.githubusercontent.com/api-evangelist/honeycomb/refs/heads/main/apis.yml
- name: Lightstep
url: https://raw.githubusercontent.com/api-evangelist/lightstep/refs/heads/main/apis.yml
- name: SigNoz
url: https://raw.githubusercontent.com/api-evangelist/signoz/refs/heads/main/apis.yml
- name: Uptrace
url: https://raw.githubusercontent.com/api-evangelist/uptrace/refs/heads/main/apis.yml
- name: OpenTelemetry
url: https://raw.githubusercontent.com/api-evangelist/opentelemetry/refs/heads/main/apis.yml
- name: Jaeger
url: https://raw.githubusercontent.com/api-evangelist/jaeger/refs/heads/main/apis.yml
- name: Grafana Tempo
url: https://raw.githubusercontent.com/api-evangelist/grafana-tempo/refs/heads/main/apis.yml
- name: Google Cloud Profiler
url: https://raw.githubusercontent.com/api-evangelist/google-cloud-profiler/refs/heads/main/apis.yml
- name: Google Cloud Trace
url: https://raw.githubusercontent.com/api-evangelist/google-cloud-trace/refs/heads/main/apis.yml
- name: AWS X-Ray
url: https://raw.githubusercontent.com/api-evangelist/aws-x-ray/refs/heads/main/apis.yml
- name: Grafana
url: https://raw.githubusercontent.com/api-evangelist/grafana/refs/heads/main/apis.yml
common:
- type: Portal
url: https://apievangelist.com
- type: GitHubOrganization
url: https://github.com/api-evangelist
- type: Features
data:
- name: Load and Stress Testing
description: Open-source and managed load generators like k6, Apache JMeter, Locust, Gatling, and Artillery simulate concurrent
users and traffic patterns against APIs to characterize throughput, error rate, and latency under load.
- name: Performance Benchmarking
description: Repeatable, scripted benchmark runs establish performance baselines and detect regressions in CI/CD pipelines
using tools like k6 Cloud, BlazeMeter, and StormForge.
- name: Real User Monitoring (RUM)
description: RUM products like Akamai mPulse, Datadog RUM, New Relic Browser, Sentry Performance, and Pingdom capture
latency, errors, and Core Web Vitals from real browser sessions in production.
- name: Synthetic Monitoring and Web Vitals
description: Synthetic checks and lab-based audits from Google PageSpeed (Lighthouse), WebPageTest, and Pingdom measure
Core Web Vitals (LCP, INP, CLS) and uptime from controlled environments.
- name: Distributed Tracing
description: OpenTelemetry, Jaeger, Grafana Tempo, Honeycomb, Lightstep, Google Cloud Trace, and AWS X-Ray collect distributed
traces across microservice calls to attribute latency to specific spans.
- name: Application Performance Monitoring (APM)
description: APM platforms like Datadog APM, New Relic, Dynatrace, AppDynamics, Instana, SigNoz, and Uptrace correlate
traces, metrics, and logs to surface slow transactions and code-level bottlenecks.
- name: Profiling and Code Hotspots
description: Continuous profilers like Google Cloud Profiler and Datadog Continuous Profiler identify CPU, memory, and
lock contention hotspots in running services.
- name: Traffic Replay and Chaos
description: Tools like GoReplay and Speedscale capture production traffic and replay it against staging or new versions
to validate performance and behavior before release.
- type: UseCases
data:
- name: Pre-Release Load Testing in CI/CD
description: Engineering teams run k6 or JMeter scenarios on every pull request to verify that p95 latency and error rates
stay within service-level objectives before merging.
- name: Core Web Vitals Optimization
description: Web teams use Google PageSpeed, WebPageTest, and RUM data to optimize LCP, INP, and CLS to meet Google ranking
and user-experience thresholds.
- name: Capacity Planning and Scalability Validation
description: Platform teams use StormForge and BlazeMeter to drive sustained load tests against staging environments to
determine maximum sustainable throughput and right-size infrastructure.
- name: Latency Regression Detection
description: APM platforms like Datadog, New Relic, and Dynatrace alert on p95 and p99 latency regressions per endpoint
or trace span after each deploy.
- name: Production Traffic Replay
description: Teams use GoReplay or Speedscale to record real production traffic and replay it against release candidates
to find performance and correctness regressions before rollout.
- name: Distributed Trace Root-Cause Analysis
description: SREs use Honeycomb, Lightstep, Jaeger, or Grafana Tempo to drill into slow distributed traces and pinpoint
the service, query, or downstream call responsible for tail latency.
- name: Continuous Profiling of Hot Paths
description: Backend teams use Google Cloud Profiler or Datadog Continuous Profiler to identify CPU and memory hotspots
in running services without rebuilding or redeploying.
- type: Integrations
data:
- name: k6
description: Open-source Grafana Labs load testing tool that uses JavaScript test scripts to drive load against HTTP,
gRPC, and WebSocket APIs, with optional k6 Cloud for distributed runs.
- name: Apache JMeter
description: Open-source Apache Software Foundation load testing tool for HTTP, REST, databases, JMS, and more, widely
used for protocol-level performance testing.
- name: Gatling
description: High-throughput, Scala-based open-source load testing tool with code-as-test scenarios and detailed HTML
reports.
- name: Artillery
description: Modern Node.js load testing toolkit with YAML and JavaScript scenarios, designed for serverless and Kubernetes-native
workloads.
- name: StormForge
description: Performance and load testing platform that uses machine learning to optimize Kubernetes resource configurations
and validate scalability.
- name: Datadog
description: Observability and APM platform offering distributed tracing, real user monitoring, synthetic monitoring,
and continuous profiling.
- name: New Relic
description: Full-stack observability platform with APM, browser-based RUM, synthetic monitoring, distributed tracing,
and infrastructure metrics.
- name: OpenTelemetry
description: Vendor-neutral CNCF standard for collecting traces, metrics, and logs, used to instrument applications for
any compatible APM or tracing backend.
maintainers:
- FN: Kin Lane
email: kin@apievangelist.com
humanURL: https://apievangelist.com
Discovery needs no key. Ratings and market analysis are Pro.
Get an API key
Free tier, no form to fill in. Signing in shares your email address with us — we
store it to create your key and to recognise you if you sign in with another
provider. See our Privacy Policy and
Terms.