Gantt Charts
Gantt charts are a project-management visualization that depicts tasks, timelines, dependencies, and progress against a calendar. This repository tracks APIs, libraries, and SaaS providers that produce, render, or expose Gantt-chart data for project planning and scheduling use cases.
Gantt Charts is profiled on the APIs.io network. Tagged areas include Gantt Charts, Project Management, Scheduling, and Visualization.
1.7/100
minimal
▬ flat
Agent
0/100
human only
0 APIs
Kin Score
 Kin Score
How this is scored →
Kin Score
How this is scored →scored 2026-10-23 · rubric v0.25.0
Composite quality — 1.7/100 · minimal
Agent readiness — 0/100 · human only
Regulatory Posture applies to this provider. Its tags matched the
Horizontal (data, software, accessibility, platform) regime, so
Regulatory Posture carries 15 points of the composite.
If this regime is wrong for your business, say so on your
provider repo — the
applicability map is public and we will correct it.
Create-or-Update Ergonomics could not be measured. We hold no machine-readable contract for
this provider to read, so there is nothing to measure a write surface against. Excluded rather than scored zero:
never-measured and measured-empty are different facts. Publishing an OpenAPI is what makes this facet — and
several others — scorable at all.
The six quality facets above are damped to 85 points between them,
because the conditional facet above carries the other
15. That is why each facet's contribution is shown against a damped
maximum: raising a quality facet moves the composite by 85% of its nominal
weight, not 100%. The full arithmetic is at apis.io/rating/.
Show this score on your site.
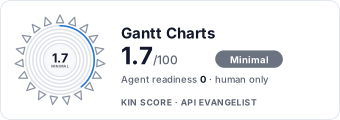 It updates itself when the score changes. Paste this where you link to your API docs:
It updates itself when the score changes. Paste this where you link to your API docs:
<a href="https://apis.io/providers/gantt-charts/"><img src="https://apis.io/badge/gantt-charts/card.svg" alt="Gantt Charts on APIs.io — Kin Score by API Evangelist"></a>Other styles, a README pill and a shields.io endpoint are on the badge page.
Improve this rating by publishing the missing artifacts — every area above can be raised, and the full rubric is at apis.io/rating/. Every facet and dimension name above is a link: it opens that measurement's own page — what it means, the exact checks that feed it, how the whole catalog distributes on it, and the providers at the top of it. This rating is computed from github.com/api-evangelist/gantt-charts: open an issue to ask a question, or submit a pull request to add artifacts.
Submit an artifact on GitHub — free →
Manage your own listing — the Influence plan, $499/mo →
Source (apis.yml)
Work with this as data
Every provider here is available over the APIs.io API and to AI agents over MCP.