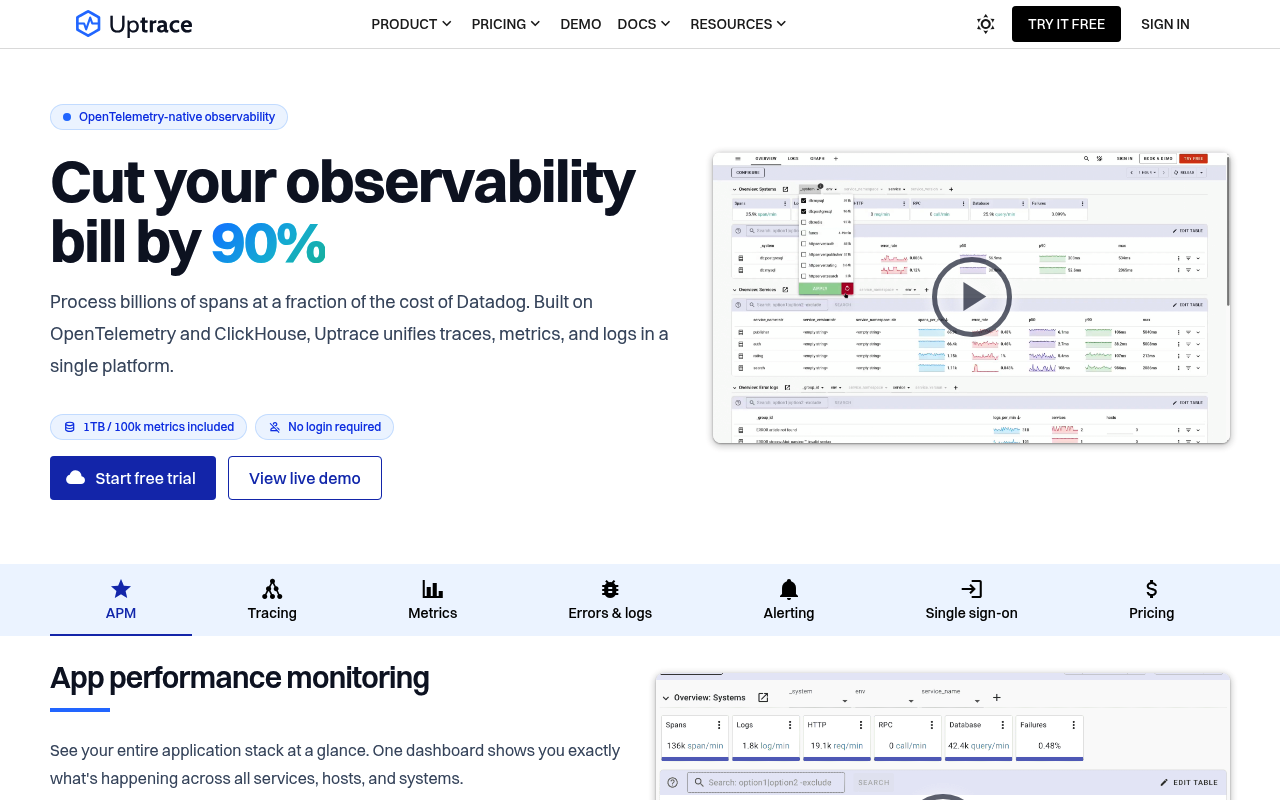
Uptrace website screenshot

Uptrace

Uptrace is an open source APM and distributed tracing platform powered by OpenTelemetry for monitoring application traces, metrics, and logs. The Uptrace API provides programmatic access to annotations, Prometheus metrics ingestion, PromQL querying, alert rules, project management, and dashboards.

1 APIs 0 Features
APMObservabilityOpenTelemetryDistributed TracingMonitoring

APIs

Uptrace API

The Uptrace REST API provides programmatic management of projects, chart annotations for deployment tracking, alert rules using PromQL, dashboard management, and Prometheus Remo...

Collections

Pricing Plans

Uptrace Plans Pricing

3 plans

PLANS

Rate Limits

Uptrace Rate Limits

5 limits

RATE LIMITS

FinOps

Semantic Vocabularies

Uptrace Context

5 classes · 19 properties

JSON-LD

API Governance Rules

Uptrace API Rules

7 rules · 4 warnings 3 info

SPECTRAL

JSON Structure

Uptrace Annotation Structure

0 properties

JSON STRUCTURE

Example Payloads

Uptrace Create Alert Example

2 fields

EXAMPLE

Resources

🔗
LinkedIn
LinkedIn
🔗
Website
Website
🔗
Documentation
Documentation
👥
GitHubOrganization
GitHubOrganization
🔗
Docker Hub
Docker Hub
🔗
MCPServer
MCPServer
🔗
LlmsText
LlmsText

Sources

Raw ↑
opencollection: 1.0.0
info:
  name: Uptrace API
  version: v1
request:
  auth:
    type: bearer
    token: '{{bearerToken}}'
items:
- info:
    name: Annotations
    type: folder
  items:
  - info:
      name: List Annotations
      type: http
    http:
      method: GET
      url: https://api.uptrace.dev/api/v1/annotations
      params:
      - name: projectId
        value: ''
        type: query
        description: Project identifier
      - name: startTime
        value: ''
        type: query
        description: Start of time range (ISO 8601)
      - name: endTime
        value: ''
        type: query
        description: End of time range (ISO 8601)
      - name: tags
        value: ''
        type: query
        description: Filter by annotation tags
    docs: Retrieve chart annotations for a project within a time range.
  - info:
      name: Create Annotation
      type: http
    http:
      method: POST
      url: https://api.uptrace.dev/api/v1/annotations
      body:
        type: json
        data: '{}'
    docs: Create a chart annotation to mark a deployment, incident, or other significant event on Uptrace dashboards.
  - info:
      name: Get Annotation
      type: http
    http:
      method: GET
      url: https://api.uptrace.dev/api/v1/annotations/:annotationId
      params:
      - name: annotationId
        value: ''
        type: path
        description: Annotation identifier
    docs: Retrieve a specific annotation by ID.
  - info:
      name: Update Annotation
      type: http
    http:
      method: PUT
      url: https://api.uptrace.dev/api/v1/annotations/:annotationId
      params:
      - name: annotationId
        value: ''
        type: path
      body:
        type: json
        data: '{}'
    docs: Update an existing annotation.
  - info:
      name: Delete Annotation
      type: http
    http:
      method: DELETE
      url: https://api.uptrace.dev/api/v1/annotations/:annotationId
      params:
      - name: annotationId
        value: ''
        type: path
    docs: Delete a chart annotation.
- info:
    name: Metrics
    type: folder
  items:
  - info:
      name: Prometheus Remote Write
      type: http
    http:
      method: POST
      url: https://api.uptrace.dev/api/v1/prometheus/write
    docs: Ingest Prometheus metrics into Uptrace using the Prometheus Remote Write protocol (protobuf-encoded snappy-compressed
      timeseries data).
  - info:
      name: Prometheus Query Range
      type: http
    http:
      method: GET
      url: https://api.uptrace.dev/api/prometheus/:projectId
      params:
      - name: projectId
        value: ''
        type: path
        description: Uptrace project ID or 'default'
      - name: query
        value: ''
        type: query
        description: PromQL query expression
      - name: start
        value: ''
        type: query
        description: Start timestamp (Unix or RFC3339)
      - name: end
        value: ''
        type: query
        description: End timestamp (Unix or RFC3339)
      - name: step
        value: ''
        type: query
        description: Query resolution step (e.g., 15s, 1m)
    docs: Query Uptrace metrics using PromQL over a time range. Compatible with Grafana's Prometheus data source and standard
      Prometheus HTTP API.
- info:
    name: Alerts
    type: folder
  items:
  - info:
      name: List Alerts
      type: http
    http:
      method: GET
      url: https://api.uptrace.dev/api/v1/alerts
      params:
      - name: projectId
        value: ''
        type: query
        description: Project identifier
      - name: state
        value: ''
        type: query
        description: Filter by alert state
    docs: Retrieve a list of alert rules for a project.
  - info:
      name: Create Alert
      type: http
    http:
      method: POST
      url: https://api.uptrace.dev/api/v1/alerts
      body:
        type: json
        data: '{}'
    docs: Create a new alert rule for monitoring metrics or error rates.
  - info:
      name: Get Alert
      type: http
    http:
      method: GET
      url: https://api.uptrace.dev/api/v1/alerts/:alertId
      params:
      - name: alertId
        value: ''
        type: path
    docs: Retrieve details of a specific alert rule.
  - info:
      name: Update Alert
      type: http
    http:
      method: PUT
      url: https://api.uptrace.dev/api/v1/alerts/:alertId
      params:
      - name: alertId
        value: ''
        type: path
      body:
        type: json
        data: '{}'
    docs: Update an existing alert rule.
  - info:
      name: Delete Alert
      type: http
    http:
      method: DELETE
      url: https://api.uptrace.dev/api/v1/alerts/:alertId
      params:
      - name: alertId
        value: ''
        type: path
    docs: Delete an alert rule.
- info:
    name: Projects
    type: folder
  items:
  - info:
      name: List Projects
      type: http
    http:
      method: GET
      url: https://api.uptrace.dev/api/v1/projects
    docs: Retrieve all projects in the Uptrace account.
  - info:
      name: Create Project
      type: http
    http:
      method: POST
      url: https://api.uptrace.dev/api/v1/projects
      body:
        type: json
        data: '{}'
    docs: Create a new Uptrace project.
  - info:
      name: Get Project
      type: http
    http:
      method: GET
      url: https://api.uptrace.dev/api/v1/projects/:projectId
      params:
      - name: projectId
        value: ''
        type: path
    docs: Retrieve details of a specific project including its DSN.
  - info:
      name: Update Project
      type: http
    http:
      method: PUT
      url: https://api.uptrace.dev/api/v1/projects/:projectId
      params:
      - name: projectId
        value: ''
        type: path
      body:
        type: json
        data: '{}'
    docs: Update project settings.
  - info:
      name: Delete Project
      type: http
    http:
      method: DELETE
      url: https://api.uptrace.dev/api/v1/projects/:projectId
      params:
      - name: projectId
        value: ''
        type: path
    docs: Delete a project and all its data.
- info:
    name: Dashboards
    type: folder
  items:
  - info:
      name: List Dashboards
      type: http
    http:
      method: GET
      url: https://api.uptrace.dev/api/v1/dashboards
      params:
      - name: projectId
        value: ''
        type: query
    docs: Retrieve all dashboards for a project.
  - info:
      name: Create Dashboard
      type: http
    http:
      method: POST
      url: https://api.uptrace.dev/api/v1/dashboards
      body:
        type: json
        data: '{}'
    docs: Create a new dashboard with panels and queries.
bundled: true