Monitoring
An index and topic collection covering API monitoring, application performance monitoring, observability, uptime monitoring, log aggregation, error tracking, distributed tracing, and incident response. API monitoring spans synthetic checks against public endpoints, real-user and application performance monitoring, logs and metrics collection, distributed tracing across microservices, error tracking, status page communication, and on-call paging when something breaks. This collection brings together commercial observability platforms like Datadog, New Relic, Dynatrace, and Splunk; open-source projects like Prometheus, Grafana, OpenTelemetry, Jaeger, and Zipkin; uptime and synthetic monitoring services like Pingdom, Checkly, Better Stack, and UptimeRobot; error trackers like Sentry, Rollbar, Bugsnag, and Honeybadger; and incident response platforms like PagerDuty, Opsgenie, Incident.io, and FireHydrant.
Monitoring is profiled on the APIs.io network. Tagged areas include API Monitoring, Observability, Uptime, Synthetic Monitoring, and Incident Response.
The Monitoring catalog on APIs.io includes 1 JSON-LD context.
Monitoring’s developer surface includes developer portal and 1 more developer resources.
0 APIs
8 Features
8 Use Cases
Notable capabilities this provider offers.
JSON-LD contexts and semantic vocabularies used across these APIs.
Standalone JSON Schema definitions for this provider's data models.
JSON Structure definitions describing this provider's data shapes.
Example request and response payloads for these APIs.
What developers build with this provider.
Pre-built integrations with other platforms and tools.
aid: monitoring
name: Monitoring
description: An index and topic collection covering API monitoring, application performance monitoring, observability, uptime
  monitoring, log aggregation, error tracking, distributed tracing, and incident response. API monitoring spans synthetic
  checks against public endpoints, real-user and application performance monitoring, logs and metrics collection, distributed
  tracing across microservices, error tracking, status page communication, and on-call paging when something breaks. This
  collection brings together commercial observability platforms like Datadog, New Relic, Dynatrace, and Splunk; open-source
  projects like Prometheus, Grafana, OpenTelemetry, Jaeger, and Zipkin; uptime and synthetic monitoring services like Pingdom,
  Checkly, Better Stack, and UptimeRobot; error trackers like Sentry, Rollbar, Bugsnag, and Honeybadger; and incident response
  platforms like PagerDuty, Opsgenie, Incident.io, and FireHydrant.
type: Index
image: https://kinlane-images.s3.amazonaws.com/shared/apis-json/apis-json-logo.jpg
tags:
- API Monitoring
- Observability
- Uptime
- Synthetic Monitoring
- Incident Response
url: https://raw.githubusercontent.com/api-evangelist/monitoring/refs/heads/main/apis.yml
created: '2026-05-19'
modified: '2026-05-19'
specificationVersion: '0.19'
apis: []
network:
- name: Airbrake
  url: https://raw.githubusercontent.com/api-evangelist/airbrake/refs/heads/main/apis.yml
- name: Amazon CloudWatch
  url: https://raw.githubusercontent.com/api-evangelist/aws-cloudwatch/refs/heads/main/apis.yml
- name: AppDynamics
  url: https://raw.githubusercontent.com/api-evangelist/appdynamics/refs/heads/main/apis.yml
- name: APIToolkit
  url: https://raw.githubusercontent.com/api-evangelist/apitoolkit/refs/heads/main/apis.yml
- name: Assertible
  url: https://raw.githubusercontent.com/api-evangelist/assertible/refs/heads/main/apis.yml
- name: Axiom
  url: https://raw.githubusercontent.com/api-evangelist/axiom/refs/heads/main/apis.yml
- name: Azure Monitor
  url: https://raw.githubusercontent.com/api-evangelist/microsoft-azure-monitor/refs/heads/main/apis.yml
- name: Better Stack
  url: https://raw.githubusercontent.com/api-evangelist/better-stack/refs/heads/main/apis.yml
- name: BigPanda
  url: https://raw.githubusercontent.com/api-evangelist/bigpanda/refs/heads/main/apis.yml
- name: Bugsnag
  url: https://raw.githubusercontent.com/api-evangelist/bugsnag/refs/heads/main/apis.yml
- name: Checkly
  url: https://raw.githubusercontent.com/api-evangelist/checkly/refs/heads/main/apis.yml
- name: Chronosphere
  url: https://raw.githubusercontent.com/api-evangelist/chronosphere/refs/heads/main/apis.yml
- name: Coralogix
  url: https://raw.githubusercontent.com/api-evangelist/coralogix/refs/heads/main/apis.yml
- name: Cribl
  url: https://raw.githubusercontent.com/api-evangelist/cribl/refs/heads/main/apis.yml
- name: Datadog
  url: https://raw.githubusercontent.com/api-evangelist/datadog/refs/heads/main/apis.yml
- name: Dynatrace
  url: https://raw.githubusercontent.com/api-evangelist/dynatrace/refs/heads/main/apis.yml
- name: Elastic Observability
  url: https://raw.githubusercontent.com/api-evangelist/elastic-observability/refs/heads/main/apis.yml
- name: FireHydrant
  url: https://raw.githubusercontent.com/api-evangelist/firehydrant/refs/heads/main/apis.yml
- name: Google Cloud Monitoring
  url: https://raw.githubusercontent.com/api-evangelist/google-cloud-monitoring/refs/heads/main/apis.yml
- name: Grafana
  url: https://raw.githubusercontent.com/api-evangelist/grafana/refs/heads/main/apis.yml
- name: Graylog
  url: https://raw.githubusercontent.com/api-evangelist/graylog/refs/heads/main/apis.yml
- name: Honeybadger
  url: https://raw.githubusercontent.com/api-evangelist/honeybadger/refs/heads/main/apis.yml
- name: Honeycomb
  url: https://raw.githubusercontent.com/api-evangelist/honeycomb/refs/heads/main/apis.yml
- name: Incident.io
  url: https://raw.githubusercontent.com/api-evangelist/incident-io/refs/heads/main/apis.yml
- name: Instana
  url: https://raw.githubusercontent.com/api-evangelist/instana/refs/heads/main/apis.yml
- name: Jaeger
  url: https://raw.githubusercontent.com/api-evangelist/jaeger/refs/heads/main/apis.yml
- name: Lightstep
  url: https://raw.githubusercontent.com/api-evangelist/lightstep/refs/heads/main/apis.yml
- name: LogicMonitor
  url: https://raw.githubusercontent.com/api-evangelist/logicmonitor/refs/heads/main/apis.yml
- name: LogRocket
  url: https://raw.githubusercontent.com/api-evangelist/logrocket/refs/heads/main/apis.yml
- name: Middleware
  url: https://raw.githubusercontent.com/api-evangelist/middleware/refs/heads/main/apis.yml
- name: Moogsoft
  url: https://raw.githubusercontent.com/api-evangelist/moogsoft/refs/heads/main/apis.yml
- name: Nagios
  url: https://raw.githubusercontent.com/api-evangelist/nagios/refs/heads/main/apis.yml
- name: New Relic
  url: https://raw.githubusercontent.com/api-evangelist/new-relic/refs/heads/main/apis.yml
- name: Nobl9
  url: https://raw.githubusercontent.com/api-evangelist/nobl9/refs/heads/main/apis.yml
- name: NodePing
  url: https://raw.githubusercontent.com/api-evangelist/nodeping/refs/heads/main/apis.yml
- name: OneUptime
  url: https://raw.githubusercontent.com/api-evangelist/oneuptime/refs/heads/main/apis.yml
- name: OpenObserve
  url: https://raw.githubusercontent.com/api-evangelist/openobserve/refs/heads/main/apis.yml
- name: OpenReplay
  url: https://raw.githubusercontent.com/api-evangelist/openreplay/refs/heads/main/apis.yml
- name: OpenTelemetry
  url: https://raw.githubusercontent.com/api-evangelist/opentelemetry/refs/heads/main/apis.yml
- name: OpsGenie
  url: https://raw.githubusercontent.com/api-evangelist/opsgenie/refs/heads/main/apis.yml
- name: PagerDuty
  url: https://raw.githubusercontent.com/api-evangelist/pagerduty/refs/heads/main/apis.yml
- name: Pingdom
  url: https://raw.githubusercontent.com/api-evangelist/pingdom/refs/heads/main/apis.yml
- name: Prometheus
  url: https://raw.githubusercontent.com/api-evangelist/prometheus/refs/heads/main/apis.yml
- name: Rollbar
  url: https://raw.githubusercontent.com/api-evangelist/rollbar/refs/heads/main/apis.yml
- name: Rootly
  url: https://raw.githubusercontent.com/api-evangelist/rootly/refs/heads/main/apis.yml
- name: Sentry
  url: https://raw.githubusercontent.com/api-evangelist/sentry/refs/heads/main/apis.yml
- name: SigNoz
  url: https://raw.githubusercontent.com/api-evangelist/signoz/refs/heads/main/apis.yml
- name: SIGNL4
  url: https://raw.githubusercontent.com/api-evangelist/signl4/refs/heads/main/apis.yml
- name: Splunk
  url: https://raw.githubusercontent.com/api-evangelist/splunk/refs/heads/main/apis.yml
- name: Splunk On-Call (VictorOps)
  url: https://raw.githubusercontent.com/api-evangelist/victorops/refs/heads/main/apis.yml
- name: Squadcast
  url: https://raw.githubusercontent.com/api-evangelist/squadcast/refs/heads/main/apis.yml
- name: Statuspage
  url: https://raw.githubusercontent.com/api-evangelist/statuspage/refs/heads/main/apis.yml
- name: Sumo Logic
  url: https://raw.githubusercontent.com/api-evangelist/sumo-logic/refs/heads/main/apis.yml
- name: Sysdig
  url: https://raw.githubusercontent.com/api-evangelist/sysdig/refs/heads/main/apis.yml
- name: Traceable
  url: https://raw.githubusercontent.com/api-evangelist/traceable/refs/heads/main/apis.yml
- name: Treblle
  url: https://raw.githubusercontent.com/api-evangelist/treblle/refs/heads/main/apis.yml
- name: Uptrace
  url: https://raw.githubusercontent.com/api-evangelist/uptrace/refs/heads/main/apis.yml
- name: VictoriaMetrics
  url: https://raw.githubusercontent.com/api-evangelist/victoriametrics/refs/heads/main/apis.yml
- name: xMatters
  url: https://raw.githubusercontent.com/api-evangelist/xmatters/refs/heads/main/apis.yml
- name: Zabbix
  url: https://raw.githubusercontent.com/api-evangelist/zabbix/refs/heads/main/apis.yml
- name: Zenduty
  url: https://raw.githubusercontent.com/api-evangelist/zenduty/refs/heads/main/apis.yml
- name: Zipkin
  url: https://raw.githubusercontent.com/api-evangelist/zipkin/refs/heads/main/apis.yml
common:
- type: Portal
  url: https://apievangelist.com
- type: GitHubOrganization
  url: https://github.com/api-evangelist
- type: Features
  data:
  - name: Synthetic and Uptime Monitoring
    description: Scheduled checks executed from globally distributed probes that hit HTTP, GraphQL, and gRPC endpoints to
      verify availability, response codes, latency, and content assertions before real users are affected.
  - name: Application Performance Monitoring (APM)
    description: Instrumentation of application code to capture request rates, latency percentiles, error rates, throughput,
      and slow endpoints across services, with code-level visibility into bottlenecks.
  - name: Distributed Tracing
    description: End-to-end traces that follow a single request across microservice boundaries, captured via OpenTelemetry,
      Jaeger, Zipkin, or vendor SDKs to expose where latency and errors accumulate in distributed systems.
  - name: Log Aggregation and Search
    description: Centralized collection, indexing, and search of structured and unstructured logs from applications, infrastructure,
      and edge components, with retention tiers and query languages for incident investigation.
  - name: Metrics and Time-Series
    description: Collection of dimensional metrics from infrastructure, runtimes, and custom application counters into time-series
      databases like Prometheus, VictoriaMetrics, or vendor backends for dashboards and alerting.
  - name: Error and Crash Tracking
    description: Capture of exceptions, stack traces, and user context from frontends and backends, with deduplication, regression
      detection, and release tracking provided by tools like Sentry, Rollbar, Bugsnag, and Honeybadger.
  - name: Alerting and Incident Response
    description: Threshold and anomaly-based alerts that flow into on-call rotations, escalation policies, and incident workflows
      handled by PagerDuty, Opsgenie, Incident.io, FireHydrant, and similar platforms.
  - name: Status Pages and Communication
    description: Public and private status pages that communicate incident status, scheduled maintenance, and component health
      to customers and stakeholders during and after incidents.
- type: UseCases
  data:
  - name: External API Uptime Monitoring
    description: Operate scheduled synthetic checks against public APIs from multiple regions to verify endpoint availability,
      TLS validity, and latency, and alert on regressions before customers report them.
  - name: Microservice Performance Troubleshooting
    description: Use distributed tracing and APM to follow slow or failing requests across microservices, identify the responsible
      span, and correlate with logs and metrics from the same time window.
  - name: SRE Service Level Objective Tracking
    description: Define and track service level indicators and objectives using tools like Nobl9, Datadog, and Prometheus,
      computing error budgets and burn rates against availability and latency targets.
  - name: On-Call Paging and Escalation
    description: Route alerts from monitoring systems to the right on-call engineer with PagerDuty, Opsgenie, or Squadcast,
      including escalation policies, schedule rotations, and acknowledgement tracking.
  - name: Incident Response and Postmortems
    description: Coordinate incident response with platforms like Incident.io, FireHydrant, and Rootly that open Slack channels,
      assign roles, track timelines, and generate postmortem documents.
  - name: Frontend Error and Session Monitoring
    description: Capture frontend exceptions, console errors, network failures, and replayable user sessions with Sentry,
      LogRocket, OpenReplay, and Bugsnag to diagnose customer-facing bugs.
  - name: Status Page Communication
    description: Publish real-time status of API components on Statuspage, Better Stack, or OneUptime so customers and integrators
      know when degradations and outages affect them.
  - name: Cost-Optimized Log Pipelines
    description: Use observability pipelines like Cribl, Vector, and Fluent Bit to route, transform, and tier log data before
      it lands in expensive indexing backends, reducing observability spend.
- type: Integrations
  data:
  - name: Datadog
    description: SaaS observability platform combining metrics, traces, logs, RUM, synthetic monitoring, and security signals
      in a single backend.
  - name: New Relic
    description: Full-stack observability platform offering APM, infrastructure monitoring, logs, browser, mobile, and synthetic
      monitoring under a unified pricing model.
  - name: PagerDuty
    description: Incident response platform that ingests alerts from monitoring tools and routes them through on-call schedules,
      escalation policies, and incident workflows.
  - name: Sentry
    description: Open-source error tracking and performance monitoring for frontends and backends with release tracking, source
      maps, and issue triage.
  - name: Prometheus
    description: Open-source dimensional metrics database with a pull-based scraper, PromQL query language, and a foundational
      role in Kubernetes observability stacks.
  - name: Grafana
    description: Open-source dashboarding and alerting frontend that visualizes data from Prometheus, Loki, Tempo, and dozens
      of other data sources.
  - name: OpenTelemetry
    description: CNCF specification, SDKs, and collector for emitting traces, metrics, and logs in a vendor-neutral format
      to any compatible backend.
  - name: Statuspage
    description: Atlassian-hosted status page service used by API providers to communicate component status, incidents, and
      scheduled maintenance to customers.
maintainers:
- FN: Kin Lane
  email: kin@apievangelist.com
humanURL: https://apievangelist.com
Every provider here is available over the APIs.io API and to AI agents over MCP.
 Kin Score
How this is scored →
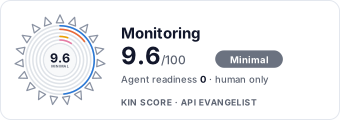 It updates itself when the score changes. Paste this where you link to your API docs: