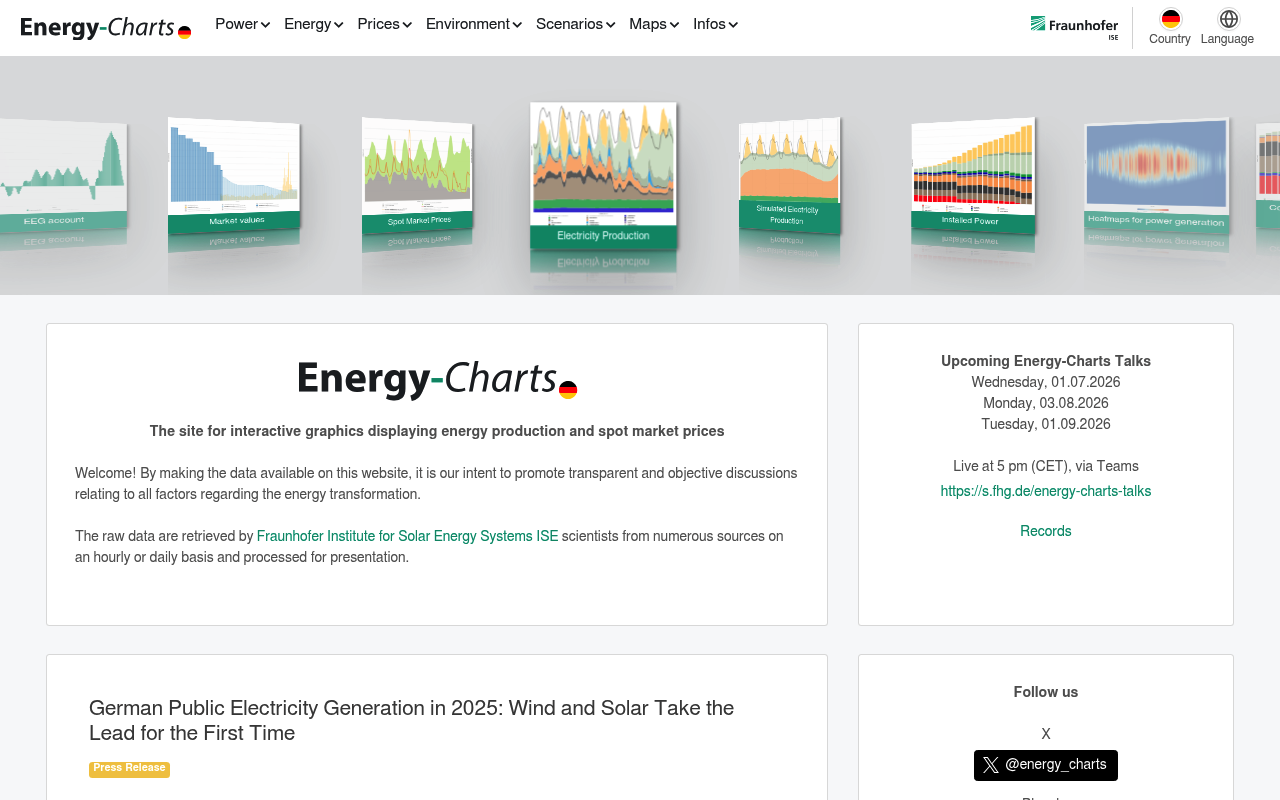
Energy Charts API
The Energy-Charts API, provided by Fraunhofer ISE, delivers European energy data including electricity production by source, day-ahead spot market prices, cross-border electricity trading and physical flows, grid frequency, installed capacity, and renewable energy share forecasts. It covers more than 40 European countries and bidding zones, supports ISO 8601, daily, and UNIX timestamp formats, and is largely licensed under CC BY 4.0.
Energy Charts API publishes 4 API contracts indexed on the APIs.io network, including Import Export API, Power API, Prices API, and 1 more. Tagged areas include Energy, Electricity, Renewables, Grid, and Europe.
Kin Score
 Kin Score
How this is scored →
Kin Score
How this is scored →scored 2026-10-17 · rubric v0.24.0
APIs 4
Individual APIs this provider publishes, each with its own machine-readable definition.
Energy Charts API Import Export API
Import/export values
Energy Charts API Power API
Query power values
Energy Charts API Prices API
Query price values
Energy Charts API Ren Share API
Renewable shares
Open Collections 6
Open, tool-agnostic API collections (OpenAPI-derived and Bruno).
API Collection
OPEN COLLECTIONEnergy-Charts import_export API
OPEN COLLECTIONEnergy-Charts import_export power API
OPEN COLLECTIONEnergy-Charts import_export prices API
OPEN COLLECTIONEnergy-Charts import_export ren_share API
OPEN COLLECTIONEnergy-Charts API
OPEN COLLECTIONPricing Plans 1
Published pricing tiers and plan structures.
Rate Limits 1
Documented rate limits and quota policies.
Energy Charts Api Rate Limits
RATE LIMITSFinOps 1
Cost, billing, and metering signals for API financial operations.
Energy Charts Api Finops
FINOPSSecurity Posture 1
Authentication, domain security, vulnerability disclosure, and trust-center signals.
Agentic Access 1
Recommended x-agentic-access execution contracts for AI agents.
Resources
Agent Surfaces 1
MCP servers, agent skills, and machine-readable catalogs
Access & Security 1
Authentication, authorization, and security posture
Operate 1
Status, limits, changes, and where to get help
Commercial 2
Pricing, plans, and the legal terms of use
Company 1
The organization behind the API
Other 1
Properties that don't map to a standard resource type
Source (apis.yml)
Work with this as data
Every provider here is available over the APIs.io API and to AI agents over MCP.